People often ask me how things are in the Elmhurst Real Estate Market and my reply is generally “things are great”. So what does great look on paper? My partner, Gary Lucido, writes a blog about Chicago real estate. He’s the man if you want to know anything about anything, especially graphs and numbers. He recently posted on his Chicago Now Real Estate Blog that February home sales in Chicago once again turned in a strong performance relative to last year. He reported that for the 20th month in a row closings beat the previous year’s numbers.
While the Elmhurst market doesn’t boast such exciting increase, it also didn’t see the same dramatic downturn over the course of the last few years that Chicago saw. Below an historic sales graph back to 2007 is shown with a 12 month moving average. Notice that we are reaching new highs in the Elmhurst Real Estate Market. Last summers spike in sales started in June 2012 with units sold remaining strong even through the normally dismal January and February. As I mentioned in January when I reported 2012 Elmhurst home sales, it’s a pretty active market out there.

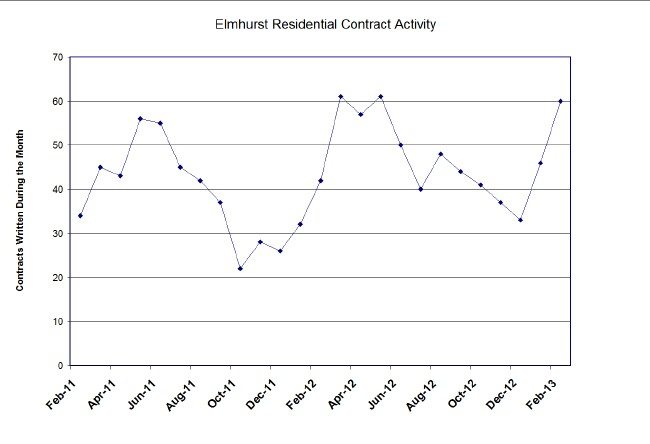
Increasing contract activity in the Elmhurst Real Estate Market and the resultant pending home sales continue to signal several more months of record setting closings. As you can see in the graph below February contract activity is level with last year but at nearly double where it was two years ago. One caveat to the chart is that it does not reflect the “decay factor” or the contracts that don’t close. A certain percentage of contracts never make it to closing. In Chicago, the decay factor is about 20%.
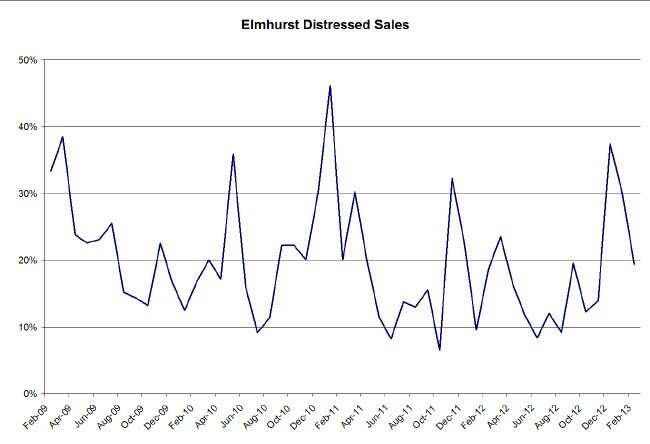
Distressed sales in Elmhurst, Illinois came in at only 20% and February is supposedly the peak time of the year for foreclosure sales. The Elmhurst Real Estate Market of course fares much better than Chicago as it relates to percentage of distressed property sales where it’s currently at 45%.
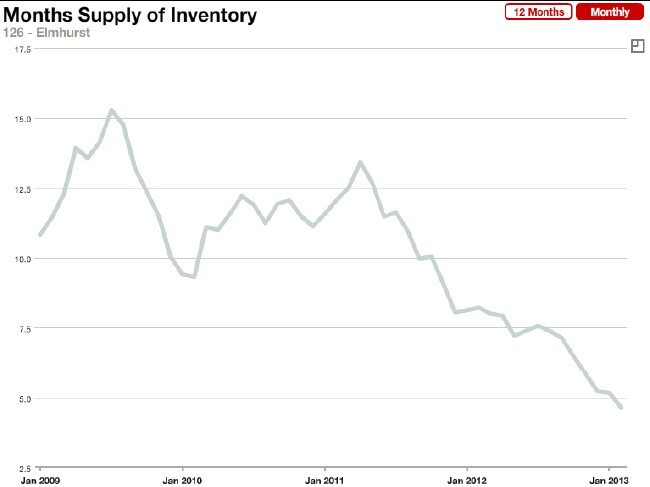
The graph below shows Elmhurst home inventory over the last 5 years courtesy of MRED. From a peak of around 16 months of supply it has now fallen to under a 5 months supply which is less than one third of its peak. Folks, we are in a seller’s market; properties that are well priced going under contract in a day with multiple offers.