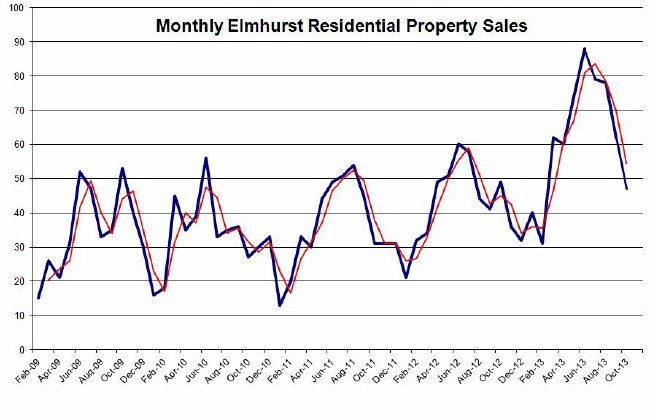
We reached new highs again in the Elmhurst Real Estate Market during 2013. Below is an Elmhurst sales graph dating back to 2009, shown with a 12 month moving average. Notice that in March 2013 the number of units sold had risen higher than we have seen in the past 4 years. Sales in March 2013 increased more than 80% from March 2012. June and July 2013 were great months to sell your home in Elmhurst, with sales reaching the highest points since 2009.
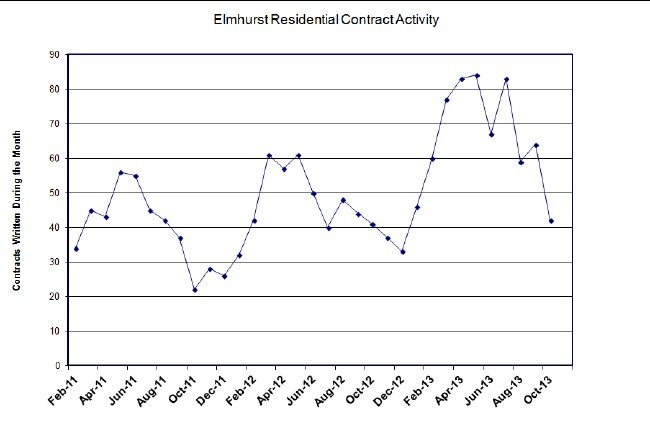
The contract activity in the Elmhurst Real Estate Market during 2013 shows several more months of record setting contracts. As you can see on the chart below, the year started out good through the normally dismal January and February months and sales continued strong each month thereafter. In July 2013, the contract activity increased more than 107% from July 2012. The contract activity in October 2013 is level with last year, but nearly double from where it was two years ago.
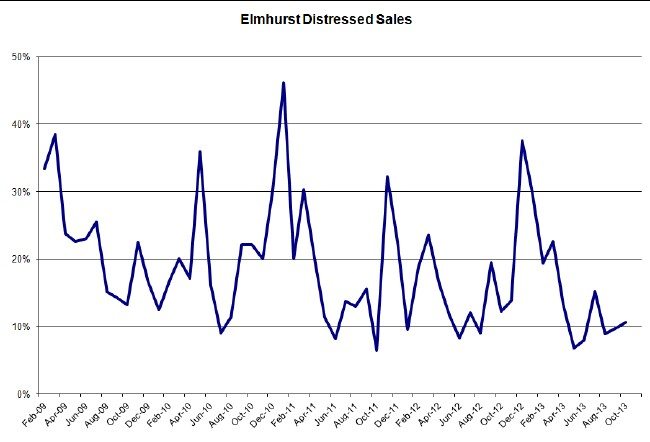
During 2013 distressed sales in Elmhurst, Illinois were at their highest in January with 30% of the units sold being distressed. In July when residential property sales were at their highest in Elmhurst, the distressed sales were only 15%. In October 2013, the distressed sales were 11% of the sold units which is 1% less than last October.
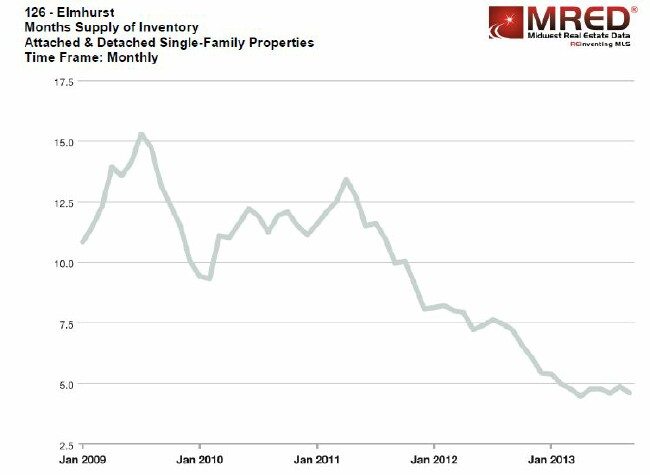
The graph below shows Elmhurst home inventory since January 2009 courtesy of MRED. In March 2013, the inventory supply of residential properties in Elmhurst fell below a 5 month supply and has remained such. In July 2009 Elmhurst had more than 15 months of inventory, 3 times more than July 2013 when there was less than a 5 month supply, indicating that we are in a seller’s market.